Event Debrief: Case Study-Assessment of the impacts of climate variability on total water storage (GWD GAU)
Event Debrief: Case Study-Assessment of the impacts of climate variability on total water storage (GWD GAU)
SACNASP CPD EVENT
Assessment of the impacts of climate variability on total water storage in the Orange-Senqu River Basin: implications for groundwater resources management by Dr. Tales Carvalho-Resende
Well done and Thank you to the GWD Gauteng Branch Chair Mr. Kwazi Majola for making this sharing & learning opportunity possible!
Background to the talk:
Alongside the effects of climate change and anthropogenic factors, natural climate cycles have considerable impacts on the hydrologic cycle. In this study, we look at how global climatic oscillations cycles, like El Niño–Southern Oscillation (ENSO) and the Indian Ocean Dipole (IOD) affect total water storage and groundwater storage in the Orange-Senqu River Basin by analyzing two large aquifers: the Stampriet Transboundary Aquifer System (STAS) shared between Botswana, Namibia, and South Africa, and the Karoo Sedimentary Aquifer shared between Lesotho and South Africa. The findings could help decision-makers prepare more effective climate-change adaptation plans at both national and transboundary levels.
About the presenter:
Tales Carvalho-Resende has more than 7 years of experience in the development and management of international cooperation projects on environmental issues, climate change, and transboundary waters. He worked at the UNESCO Intergovernmental Hydrological Programme (IHP) where he coordinated and supported research and capacity-building activities on groundwater and climate change, water diplomacy, conflict resolution, and international water law that lead to the establishment of the first arrangements for the governance of a transboundary aquifer in Southern Africa (Stampriet Aquifer in 2017 – Botswana, Namibia, and South Africa) and Central America (Ocotepeque-Citala Aquifer in 2019 – El Salvador and Honduras). He is a Brazilian, Ph.D., Earth Scientist and holds an MA in International Affairs and LLM in Climate Change Law and Policy.
We appreciate his excellent presentation and the encouragement by Dr Tales for sharing the materials.
" In vain have you acquired knowledge if you have not imparted it to others." - Deuteronomy Rabbah
Q & A Session
Transcription
(Live questions and responses to these questions are transcribed and might contain capture errors. We will continue with the quality check and update the post accordingly.)
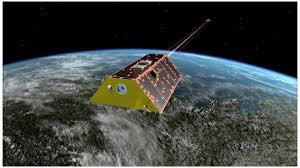
Q: Thanks Tales for the wonderful presentation. It is always encouraging to see the application of GRACE-derived data, particularly in Southern Africa given that GRACE is underrepresented. I would like to find out what was the time mean that was used to estimate the total water storage changes?
Tales: To give you further information about the GRACE satellite. The GRACE data have to be considered very carefully. Why? Because it provides an overview on a large scale and not at the local level. GRACE mainly ‘sees’ the fluctuations of shallow aquifers but not deep aquifers. Most of the time this is enough because most of the groundwater abstraction occurs from shallow aquifers. GRACE has been out in the skies since 2002. With the model, we were able to add 20 more years going back to 1980 - which is fantastic. So this is what we tried to do, go back to the past to reconstruct these fluctuations.
Q: The applicability of GRACE on large aquifers (such as the Stampriet) you mentioned. So how is the applicability of GRACE on the smaller aquifers; and also the applicability of GRACE on a national scale for instance if you want to do it for the whole country total water storage estimations and what is the impacts on the water storage?
Tales: One of the aims of this study was to have a first picture of the correlations between groundwater and climate change at a large scale because there have been very few studies on that particularly in Africa. So, I would say a first step is to have a general big picture at a large scale (i.e. the same study can be replicated at the Southern Africa level) and then once we have that first picture, we can already identify some correlations. In Southern Africa, we can see that there is already an El Nino correlation and then you go into detail and further studies can be done. So, I can say that this study can easily be replicated at a large scale in other regions/ country level but is just to give a first ‘snapshot’ of the situation.. Then you follow with further studies at the local level.
Q: Is there any reason why you chose this study area?
Tales: Well, we have chosen this area because we were working with the support of UNESCO in that region. We had the support to assess these impacts of climate variability in the Stampriet aquifer and then we said ok let us see what is also happening in the Karoo Sedimentary aquifers so as to have a broad picture of groundwater dynamics in the Orange-Sengu Basin. We have also applied the same methodology of other regions of the world and the results were quite interesting.
Q: Did you fit groundwater level data with the modeled results? If so, how good was the model fit invalidation?
Tales: If you have a look to slide 17. The answer is yes. We validated the model both in the GRACE (starting from 2002 until now) and the groundwater level data time-frame. Again, the groundwater level data might not have been representative of all of the basin but the very few that we could collect and were available, fitted very well and we felt confident to go further with these correlation of climate indices.
Q: Kwazi spoke about the scale with regards to applying GRACE data to a small scale. I personally tried that and the results were very coarse but looking at other studies, myself and others actually found that at scales greater than 150,000 km2 that is when you can start to see and get better results. We actually did not find absolute values in terms of values of total water storage but rather just the anomalies. Also using the soil moisture data and abstracting it from the GRACE the total storage data that actually gave us some insight into what is happening to groundwater level. So far we have not found or could use any long term data that is representative of areas less than the 150,000 km2 in SA and I think it is also the same issues that you faced when doing your study in the Stampriet. So I am not sure if you or somebody in your team have found some way to downscale so that can maybe be able to apply GRACE at a more local scale?
Tales: Yes, unfortunately for the time being we have not been able to go deeper into local scale. Exactly one of the challenging issues are the ones that you mention. So as you know groundwater fluctuates differently from one borehole to another, so a borehole that is only a few km away can have a different dynamic than another, and what we would need -I would say- to really make sure this model is robust is to have a strong groundwater level monitoring network at work in which you would allow you to have the average of all the groundwater level data. What GRACE does offer is usually an average of what is happening in the 150,000 km2 to give you one number. So that is the challenging issue. We did apply the same model in other aquifers that have a very good monitoring network mainly in the Unites States, and it worked very well. But as I said – this is only to show you what can happen at large scale.
Q: Is it possible to simulate the longer time effects of the Milankovitch cycles (100,000 year cycles) which effects of changes in Earth’s position relative to the Sun and are a strong driver of Earth’s long-term climate, and are responsible for triggering the beginning and end of glaciation periods (Ice Ages)
Tales: This is quite challenging as we don’t have good and reliable data on rainfall and evapotranspiration at long term to extend the model. The current version of the model starts at 1980 because our data on evapotranspiration starts by then.
Q: How long after the El Nino/La Nina has started do you start to see the impacts on the groundwater storage changes or was it not part of the study?
Tales: We could see here that it was highly responsive so only a couple of months afterwards we could already see the impacts. Again this is only for shallow aquifers but this is very important information in the sense that it is highly responsive. So if you know there is a drought coming you will have an impact very soon after and this is the reason why it is really important to really be in touch and discuss with the climate people e.g. the different meteorological agencies and so on, because if you can have a good forecast of what happens with the rainfall patterns then you can have a good forecast also for groundwater. In this case we have seen that the aquifers are highly responsive to rainfall patterns which are intrinsically linked with climate indices.
Q: What is your depth of "shallow" aquifers?
Tales: By shallow aquifers we mean here unconfined aquifer and the water table level that we could get here from the different chronicles were usually a couple of meters (approx. 10-20).
Q: What was the effect of human abstractions? How were these included in the model?
Tales: This is an interesting question as yes, it is difficult to get data on abstraction. This model here did not consider human abstractions but what we could see here and what we could see in other studies is that if you have a dry period it means that abstraction increases and the trend decreases. So in our study we talk about trends not numbers. The results of the model are shown in a normalized scale so abstraction can be “implicitly” considered because of that. It is very difficult to give you numbers on abstraction because it is not always very reliable data, so keep in mind the trends. The takeaway message here is that usually when you have a decreasing trend it also mean that you have more abstraction this means that the trend goes even down.
Q: The groundwater system seems to be more sensitive to human activities than climatic changes. Is long term still relevant or urgent? Long-term? 200 years or so
Tales: It is very difficult to separate what is the human component and what is the climatic component because both are together. When it comes to groundwater – if you have a drought – this means that you will abstract more so both are intrinsically linked. That is why it is very difficult to disaggregate both of them. In the long term, this is still relevant, because the information can help us to better set up some MAR schemes. For instance, we could see a AMO positive phase (current one since mid 1990s) could bring water storage down, and then once this cycle could flip to another phase we could have some better days. So this can already give us some time of what can happen and how we can prepare in the long term.
Q: Presumably the water level measurements were taken from boreholes, which normally would be associated with human abstraction?
Tales: Yes. We tried to collect the longest and most continuous water level chronicles. Unfortunately, there are very few.
Please contact Mr Kwazi Majola (Branch Chair GAU) for more information on this subject: [email protected]